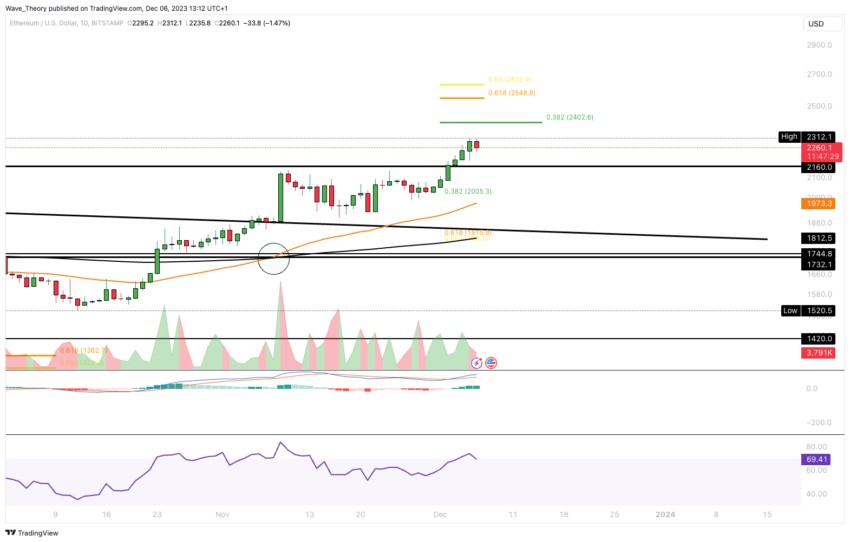
Ethereum (ETH) appears poised for a major price breakout, with technical indicators suggesting a potential 30% rally that could push the cryptocurrency above $4,000.
The second-largest cryptocurrency by market cap is currently holding steady above $3,440, demonstrating strong market resilience. Technical analysis shows the EMA50 supporting an optimistic outlook, while the stochastic oscillator hints at building bullish momentum.
Market data reveals substantial futures liquidations totaling $62.88 million in the past 24 hours, with short positions accounting for $34.71 million of the total. This imbalance in liquidations, favoring short position closures, adds fuel to the bullish narrative.
A key technical development is ETH's break above the $3,400 neckline resistance of a Head-and-Shoulders pattern, reinforcing the positive trajectory. If the current momentum continues, analysts project potential targets at $3,732 and ultimately $4,522.
Adding weight to the bullish case, whale activity shows renewed confidence in ETH's prospects. The number of addresses holding at least 1,000 ETH has climbed to 5,557, approaching the monthly high of 5,561. This accumulation by large holders typically precedes positive price action.
The immediate support level sits at $3,320, while resistance is established at $3,570. However, traders should note that a daily close below $3,000 would invalidate the bullish outlook, potentially leading to a retest of $2,817 support.
Both the Relative Strength Index (RSI) and Awesome Oscillator are trending upward above neutral levels, indicating growing buying pressure in the market. These momentum indicators align with the broader bullish sentiment surrounding Ethereum.
As ETH maintains its position above $3,400, the stage appears set for a continued upward movement, with $4,093 emerging as a realistic target for this rally phase.